Bitcoin Under Pressure Toward $90,000: The End of the Bull Cycle? | November Report
Key Takeaways:
Bitcoin closed October with a strong correction but avoided structural damage. The price has been consolidating between $105,000 and $116,000, showing balanced pressure from buyers and sellers. Analysts see the current phase as a reset rather than the end of the cycle. Institutional inflows into Bitcoin ETFs remain steady after October’s outflows, reflecting cautious confidence. Liquidity and sentiment remain the key drivers for a potential year-end rebound.Bitcoin (BTC) closed October on a pessimistic note, moving in step with the broader crypto market. The community is split. Some believe BTC still needs to sweep liquidity below current levels before a new rally can begin. Others are less optimistic, suggesting the bull cycle may already be over.
As of Oct. 31, Bitcoin’s yearly performance stands at around +53%. With two months left before the end of 2025, the question remains whether the coin can regain momentum or investor enthusiasm has already cooled.
As experts note, there’s still room for a deeper pullback and a possible test of the $90,000 level, while buyers show little conviction to break the $116,000.
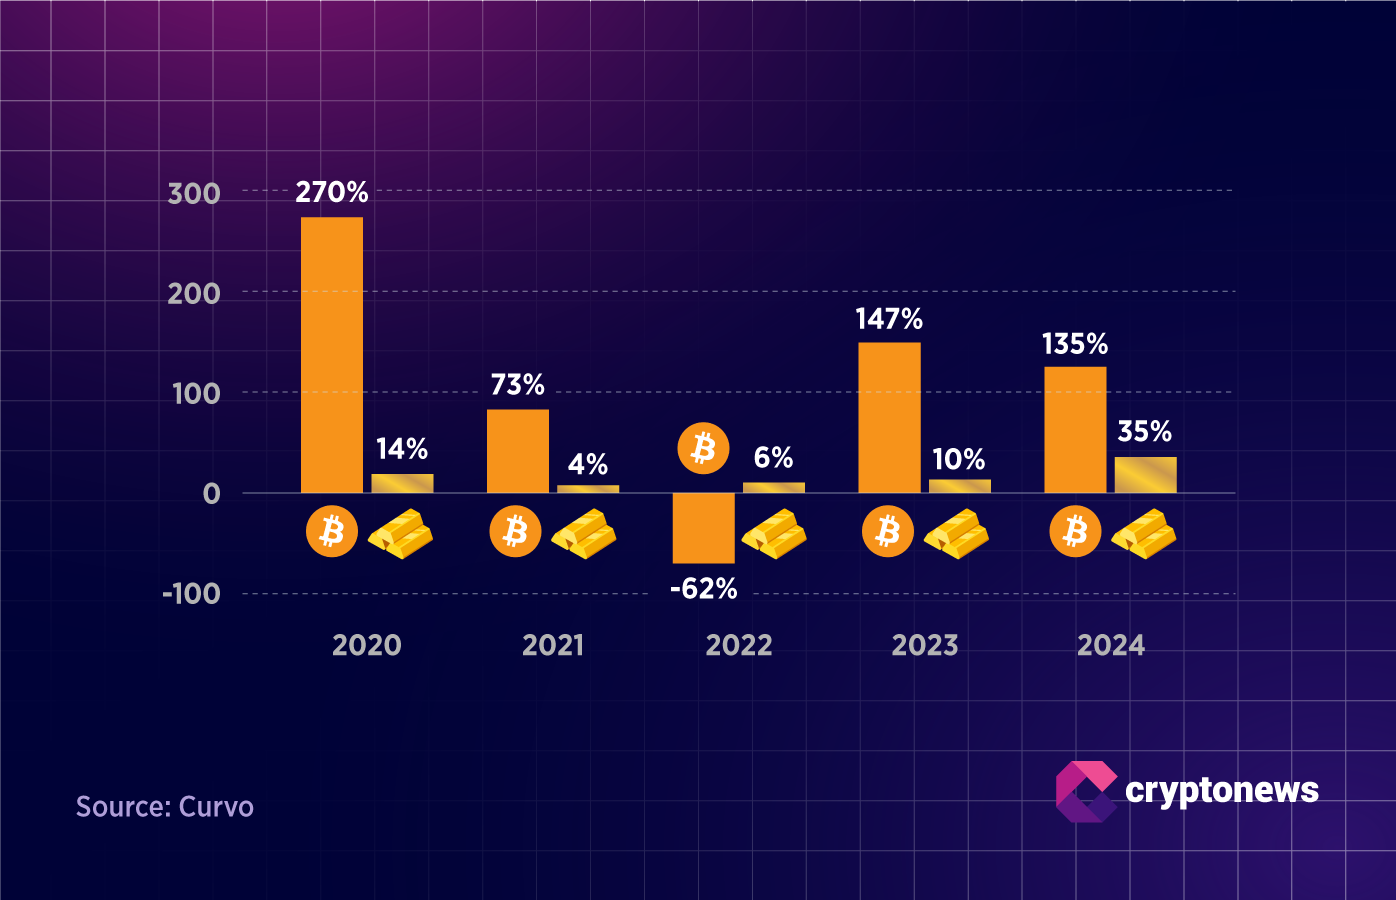
Looking at Bitcoin’s annual returns, the past five years have been mostly positive — above 50% each year, except for 2022, when BTC fell by 62%. This consistent resilience is part of what earned Bitcoin its “digital gold” status. By comparison, the spot gold price rose roughly 35% in 2024, marking its best performance in the past five years. That strength underscores how unstable the global environment remains.
If Bitcoin takes a more pessimistic path and loses its $100,000 support level, can it still be considered digital gold? In this Cryptonews monthly report, we explore what lies ahead for the market’s leading asset.
‘This Feels Like a Reset, Not a Cycle Peak’
The chart below highlights Bitcoin’s price range following the sharp Oct. 10 selloff. Compared with Ethereum and altcoins, Bitcoin has shown greater resilience during the correction. BTC is currently trading between $116,000 and $105,000, moving in what looks like a game of ping-pong.
Each time the price dips toward $106,000, it bounces back to the upper end of the range near $116,000. For now, the $105,000 support is holding, yet there’s still no breakout in either direction. Neither buyers nor sellers seem to be in control.
Cais Manai, Co-Founder and Head of Product at TEN Protocol, told Cryptonews that the current structure doesn’t signal the end of the cycle but rather a mid-cycle reset. He adds that a deeper correction could be followed by a strong rebound if macro conditions improve:
I don’t think the cycle’s over. No euphoria yet, no retail mania, no blow-off tops, no mass FOMO. We’ve seen big ETF flows, but the average investor hasn’t shown up. Could BTC tag $90,000 on more macro pressure? Possibly. If the Fed softens up and liquidity returns, we probably get one last leg higher — BTC $120,000, ETH mid-$5,000, alts ripping. That’s when euphoria kicks in.
Speaking with Cryptonews, Maria Carola, CEO of StealthEx, agrees that the path forward depends heavily on liquidity and capital inflows. She notes that while the setup for a year-end rally is there, it’s not guaranteed:
It’s possible but conditional. Historically, Q4 is often stronger, and market seasonality plus improving on-chain liquidity are all positive tailwinds.
According to Carola, the outlook for a new all-time high hinges on several key factors aligning:
Reaching a new ATH in November–December will depend on three things in sync: a renewed wave of sizable net inflows, the absence of a major macro shock, and constructive optics on regulation. If these are aligned, a late-year push is plausible. Otherwise, consolidation inside the current range is more likely. I’d frame it as scenario-driven rather than a binary yes/no, as the probability increases materially if liquidity and inflows pick up.
Institutional Investors Are Cautious, but They’re Returning to Bitcoin
Early October brought a wave of institutional activity into Bitcoin ETFs, according to CoinGlass. On Oct. 6, inflows reached more than $1 billion, followed by another strong day on Oct. 10, just before the market crash.
At that point, sentiment was overwhelmingly bullish: ETF inflows were rising, Bitcoin was testing new highs, and altcoins were catching up. In hindsight, the setup now looks like a classic trap that pushed many traders into long positions before the correction. When prices dropped on Oct. 10, Bitcoin ETFs saw a $4.5 billion net outflow, a major move by any standard.
However, throughout the rest of the month, flows stabilised. There were several smaller outflows, but also steady inflows. The balance between the two suggests investors remain cautious but haven’t exited the market altogether.
That pattern mirrors Bitcoin’s sideways price action, as the asset consolidates between $105,000 and $116,000. Carola notes that no single group is currently dictating the market’s rhythm. Instead, it’s a coordinated dance between different types of capital:
For now, there is no single actor setting the rhythm. It’s more accurate to say that the market is being orchestrated by a mix of passive flows, including ETF allocations and treasury managers, active liquidity providers such as market makers and OTC desks, and risk-hedging behaviour from institutional desks.
She adds that the dominant force shaping Bitcoin’s range isn’t retail speculation but large, long-duration capital pools:
Retail appears at the margins, but it’s the large, long-duration pools of capital such as ETFs, exchanges, and custody providers that increasingly determine how wide or narrow ranges become. Together, liquidity providers and institutional allocators set the tempo by deciding where and when to post large bids and offers, as macro headlines and policy signals provide the beats.
Bitcoin Survived the Shakeout
The October correction was sharp, but it didn’t lead to structural damage. Bitcoin’s range-bound movement reflects a market still in transition rather than decline. Institutional flows show caution, not capitulation, while long-term holders continue to view BTC as a hedge against uncertainty.
Early November brings a dense lineup of macroeconomic data that could influence Bitcoin’s short-term price action. At the same time, the ongoing U.S. government shutdown continues to affect data releases, leaving some key indicators delayed or missing. This combination could spark periods of high volatility in both directions as traders react to fragmented information and shifting expectations.
The coming weeks will test whether stability can evolve into renewed momentum, but for now, Bitcoin’s story remains one of quiet resilience. If key levels fail to hold and the price slips toward $90,000, it could also challenge Bitcoin’s reputation as digital gold. Such a move would put its yearly performance well below previous cycles, raising new questions about its role as a long-term store of value.
Economic and Crypto Calendar for November 2025
November 3 — S&P Global Manufacturing PMI (October)A leading indicator of U.S. manufacturing activity. Readings below 50 suggest contraction and may pressure risk assets, including Bitcoin.
November 3 — ISM Manufacturing PMI (October)One of the most closely watched U.S. economic reports. A weak figure could increase expectations for Fed easing and lift crypto sentiment.
November 3 — ISM Manufacturing Prices (October)Tracks input cost trends in the manufacturing sector. Rising prices could renew inflation concerns and influence Fed rate expectations.
November 4 — JOLTS Job Openings (September)Measures the number of job vacancies in the U.S. labor market. A strong reading signals tight employment conditions, while a decline could support expectations of slower economic growth and a more dovish Fed stance.
November 5 — S&P Global Services PMI (October)Provides insight into business activity in the U.S. services sector. A reading above 50 points to expansion, supporting risk sentiment across traditional and crypto markets.
November 5 — ISM Non-Manufacturing PMI (October)A key measure of service-sector strength. Strong results could reinforce the Fed’s cautious stance, while weaker data may boost hopes for policy easing.
November 13 — CPI (MoM) (October)The monthly U.S. inflation report. A higher-than-expected increase could pressure risk assets and delay Fed rate cuts, while a soft print may support Bitcoin’s recovery.
November 13 — CPI (YoY) (October)The headline inflation figure. Year-over-year trends will guide investor expectations for monetary policy and could drive short-term volatility across crypto markets.
November 21 — S&P Global Manufacturing PMI (November)The flash reading for U.S. manufacturing activity in November. Early signs of slowdown or recovery may influence risk appetite heading into year-end.
November 21 — S&P Global Services PMI (November)An advanced look at service-sector performance. Strong data could reinforce confidence in the U.S. economy, while weakness may renew pressure on the Fed to ease policy sooner.
Disclaimer: Crypto is a high-risk asset class. This article is provided for informational purposes and does not constitute investment advice.
The post Bitcoin Under Pressure Toward $90,000: The End of the Bull Cycle? | November Report appeared first on Cryptonews.